top of page
Commercial Real Estate Property Hub
Serving commercial real estate owners with exclusive market data, and access to a team of industry professionals.
_macbookgrey_front.png)
_macbookgrey_front.png)
Project Specifics
-
UX Designer
-
Jan 2021 - May 2021
-
Commercial Real Estate
THE PROBLEM
Small commercial real estate owners are underserved
Commercial real estate owners fall into one of two categories: Institutional owners, or Non-institutional owners. Institutional owners are classified as having real estate portfolios worth more than $20 million, conversely non-institutional owners have smaller properties resulting in portfolios under $20 million.
Both owners use the same services to operate their business, and get the highest and best use of their property. However, service providers are not financially inclined to support non-institutional owners as it requires them to do the same amount of work for institutional owners but with a lower payout.
With commercial properties that are worth less than $20 million accounting for 6800 transactions per year (approximately 85% of the commercial real estate transaction market) there are massive opportunities for innovation/disruption.

THE SOLUTION
Find commercial real estate, track market trends, and learn about the local demographic
1
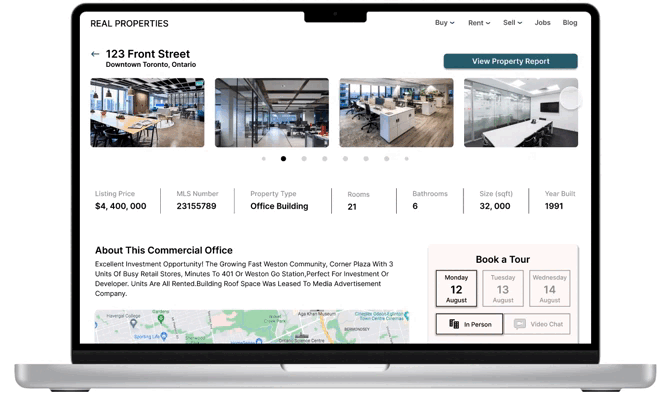
Learn everything about listed commercial properties
Locate commercial properties in any city in Canada
Get comprehensive, property-specific data. Including interior/exterior photos, tour bookings, and mortgage calculations
Utilize market trends to support with property analysis, trends can be used to support or oppose purchasing decions
Discover popular foot-traffic areas, plan how your business will adapt given the surroundings

2
Provide historic commercial real estate data to inform purchasing decisions
Customized property reports per region
Sale comparisons, by vacancy rate and sales volume
Renter-specific information about current property occupants
Asset type data categorized by office floor, storefront business, industrial property, etc
Physical building data, such as recent renovations/repairs, on-site equipment maintenance periods, and building inspection reports
3
Provide a personalized concierge service from a team of highly experienced agents
Easy access to exclusive commercial real estate data
Get in touch with current owners directly, no more investigative work to find their contact information
Get instant advice on all things commercial real estate related from agents with 20+ years of experience
Stay informed about the latest news and events in your region that may affect commercial property sales

OUR DESIGN APPROACH
What I championed in the design process
1
Define
Understanding problem space
Defining project goals
Value proposition mapping
Stakeholder interviews
2
Research
Surveying
User interviews with agents
Task analysis
Persona creation
Journey mapping
Affinity mapping
3
Design
Crazy 8's design ideation
Sketching
Wireframing
4
Evaluate
Agent follow-up interviews
Usability testing
Guerilla testing
Wireframe usability testing
Design iteration
2 rounds of usability testing
Final prototyping
USER RESEARCH
Commercial property owners are willing to pay for data and advisory real estate services
After conducting PollFish surveys with 141 commercial property owners in Toronto with portfolios less than $20 million, the following findings were gathered:

61% of owners are willing to work with agents that use a digital commercial real estate platform.

85% of owners believed more insightful valuation data would help them sell their property

86% of owners were willing to pay for valuation data that would help them sell
Competitive analysis
A competitive analysis of both commercial and residential brokerages in Canada would reveal what direct competitors are offering and what R-LAB's advantage would be.

Research takeaways
1)
Commercial property owners are open to working with agents who operate digitally
2)
Property owners are more likely to sell if provided access to improved market intelligence
3)
Owners have mixed experiences when doing transactions with agents
4)
The majority of property owners are planning to sell in the near future and need valuation support
5)
Owners will pay for better data that will increase the likelihood of their property being sold
PERSONA CREATION
Personas include commercial property owners, buyers, and realtors
An understanding of the goals and pains of the types of people that will be using a product/service is crucial to retaining them as customers. User personas allowed me to really understand what makes a digital brokerage beneficial by understanding the expectations, concerns, and motivations of target users. By narrowing down the focus, each feature that the product offers can deliver value that solves their pains by helping them achieve their goals.
Property owner

Buyer/investor

Realtor

JOURNEY MAPPING
Empathizing with customer expectations

Property owner

Buyer/investor
.png)
Realtor
USER FLOWS
How personas interact with each other during a property transaction

DESIGN IDEATION WITH WIREFRAMING
Property owners preferred a central hub for finding properties, with other features structured around it
Glance at multiple listings, property specifics, and their location at once
Strengths
-
Gives users the ability to browse quickly and still gather value information on each property
-
Property buyers/investors appreciate the map interface that allows them to see
Weaknesses
-
Users must click into an individual listing in order to see more property photos
-
Property markers on the map might get cluttered if there are many listings in one region


Single page for exclusive data from Teranet Canada
Strengths
-
Users can get reliable and up-to-date data from Canada's largest real estate data registry
-
View property specifics, location data, and asset type characteristics
Weaknesses
-
Property owners and buyers that are in search of very particular information may have to browse through each tab before finding what they are looking for


.png)

FINAL PRODUCT
High fidelity screens
_macbookgrey_front.png)
_macbookgrey_front.png)
_macbookgrey_front.png)


CONCLUSIONS + LESSONS LEARNED
What I'd do differently next time
1)
Give ideas a chance to thrive. In the ideation stage there were many potential design directions that I immediately discarded without comprehensive reasoning. There is value in giving more of those ideas some time investment, even if they do not make it to the final design there can be valuable insights uncovered from understanding why they did not work. Doing this will also force me to provide more in-depth reasoning for rejecting designs, and also improve my design communication.
2)
Consider "UX debt" when prioritizing time. Iterating on the high fidelity prototype can go on forever, instead of letting that happen I will prioritize which features of the design impact users the most. By prioritizing usability, accessibility, efficiency, consistency, learnability, and aesthetics with the most impactful features, I can get a clear idea of how to allocate my time much more efficiently.
3)
Focus more time on accessible site navigation. With the site containing three main features, users should have an intuitive means to navigate between them. Next time I will spend more time defining the overall site hierarchy, then mapping out multiple navigation concepts using competitive analysis for inspiration. After which I will conduct separate usability testing sessions for site navigation alone, in order to understand how our users want to switch between features.
_iphone13midnight_portrait.png)

bottom of page